Debugger Tips for .Net Devs with Visual Studio 2015
Debugging is hard, time consuming less fun than writing the program correctly the first time. Thus, I’ve never tried debugging myself. For my readers:
You can start debugging a process directly by using “Step Into” before a process has started. Useful if you don’t know where a programs entry point is.
Return values of methods are now visible in the Locals window. No more local variables created just for debugging purposes.
When you have multiple method calls on a line, you can “Step Into Specific” to choose which method to step into. A timesaver if there ever was one.
Using the Call Stack, you can select a point in the program and “Run to Cursors” to step into that point.
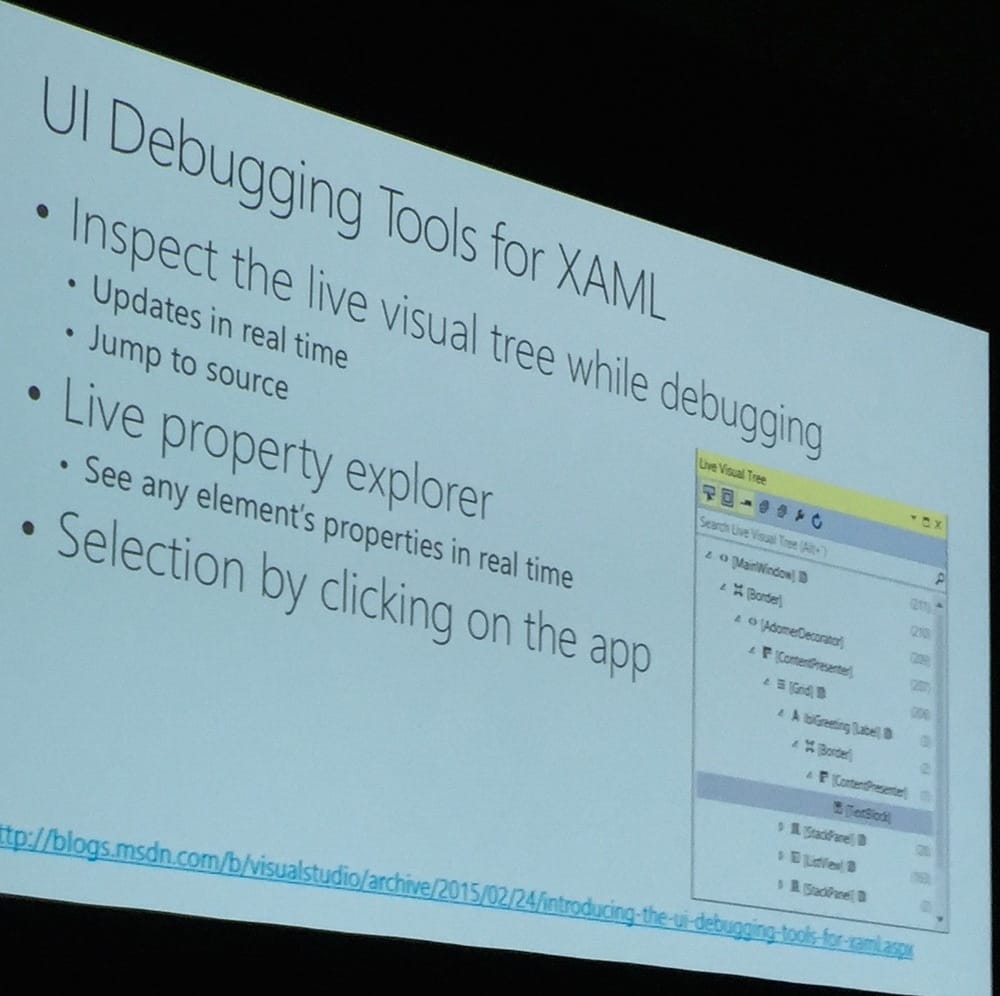
WPF now has its own debugger visualizer. It’s easy writing your own visualizers for your own data structures.
Use the DebuggeDisplay attribute to change your class’ visualization in the debugger. No more unneeded ToString declarations.
Pinning values during debugging also makes them available after debugging has finished. The debugger helps even when it’s not running.
Visual Studio 2015’s debugger now supports lambda expressions, both in the watch windows and in edit and continue. Hello LINQ!
Breakpoints with configured Actions are powerful and can now be created without opening a modal dialog. Progress. Automatic continuation enables advanced logging without littering your code with temporary logging statements.
Break when thrown now has a search box, making it easier to break at the source of exceptions without breaking the F5 key.
Other goodies:
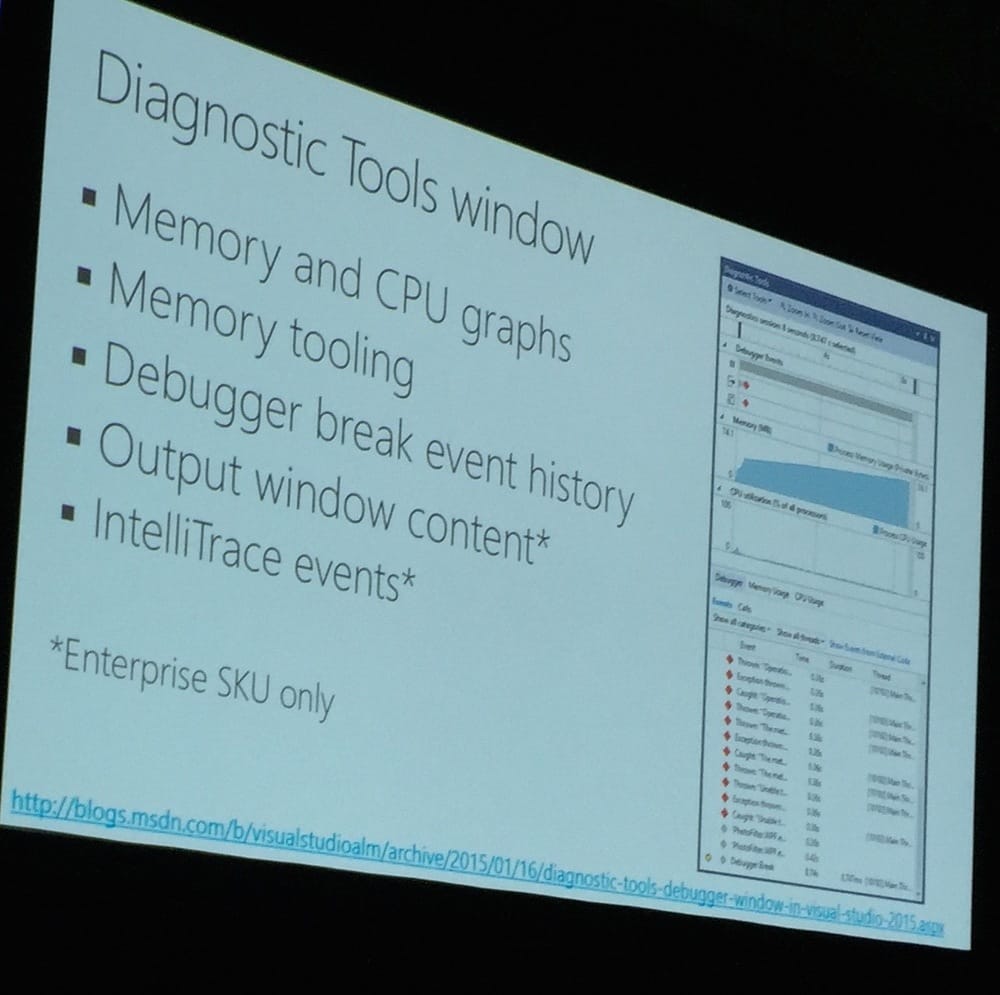 Profiling is awesome
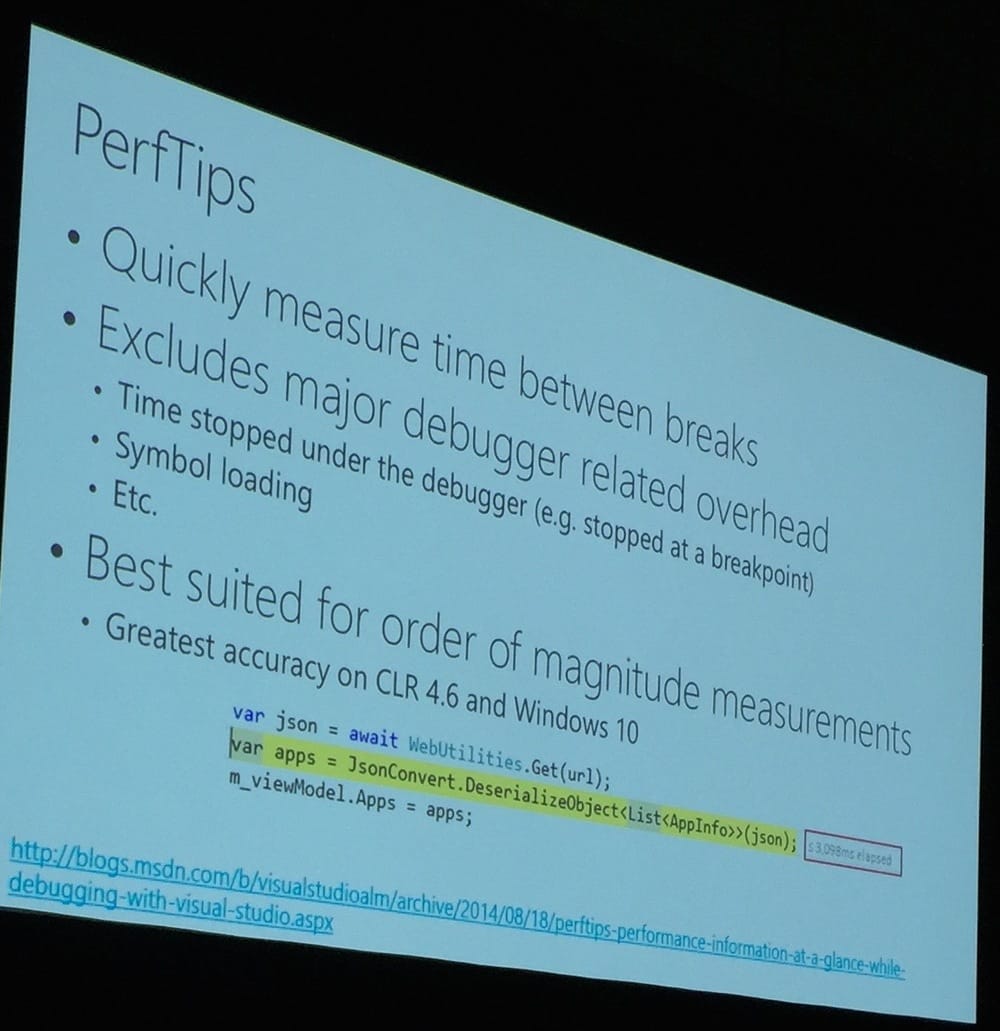 Timings are awesome
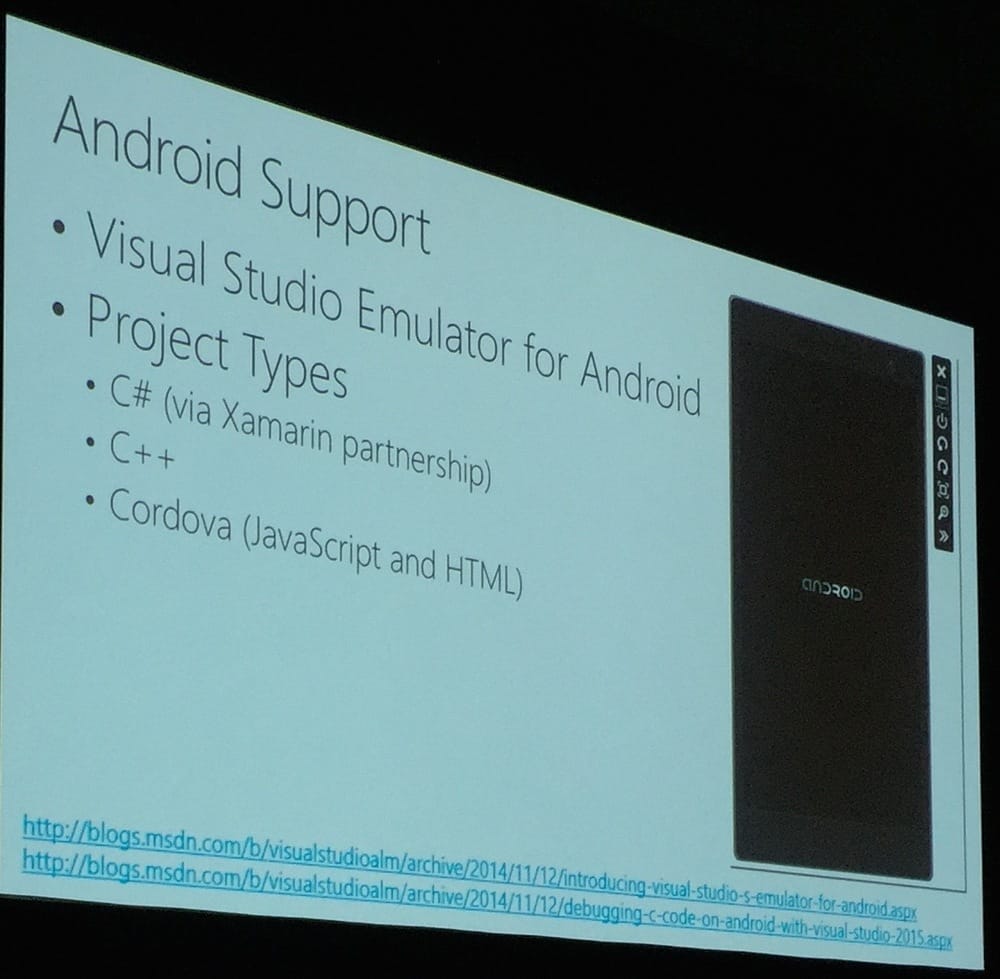
 My favourite feature of the future
 Who would want this?