Debugging Performance Issues Using Visual Studio 2015
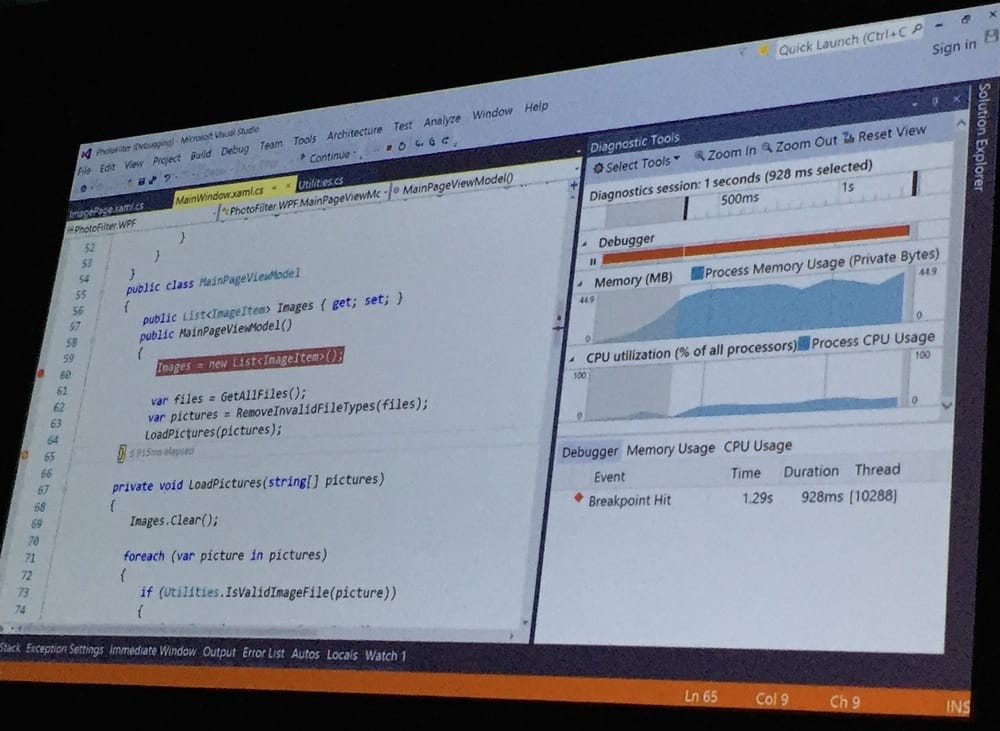
Bad performance leads to poor user experience. Continuously evaluate performance during debugging using PerfTips, Memory Tool and CPU graph.
 Debugging is now useful.
PerfTips shows you the time used between steps. Overhead from debugging is removed from the number. Utilize edit and continue and moving of the instruction pointer to test different implementations without recompiling. This works anywhere you can debug, even remote debugging and while debugging unit tests.
While looking at the CPU graph, look for spikes. It could be one core at 100%.
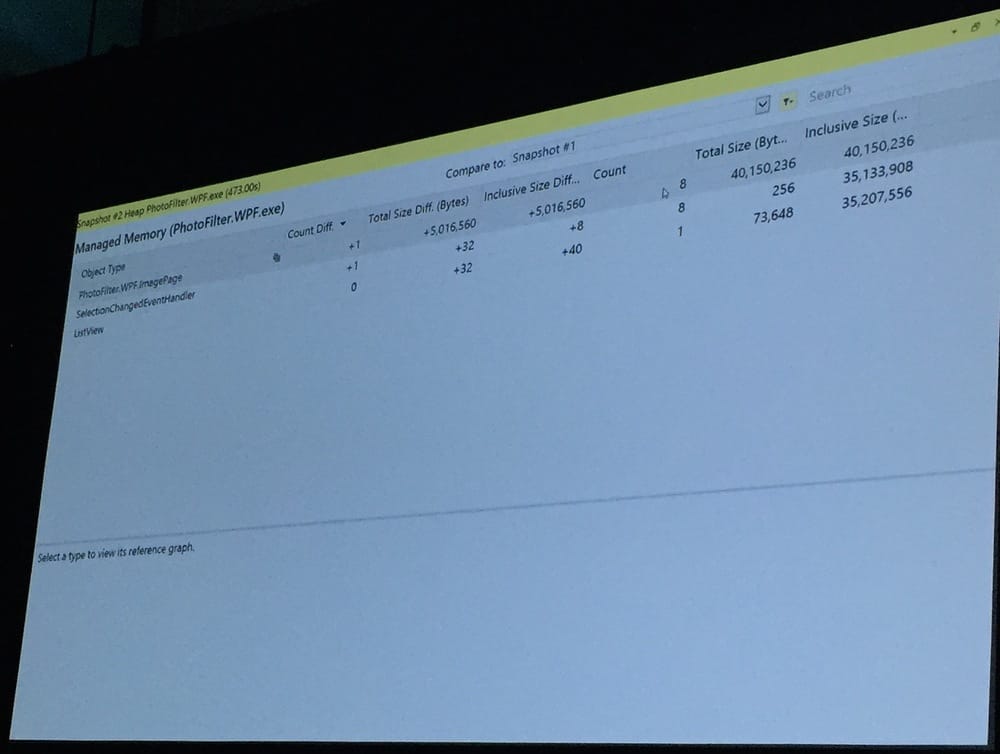
Memory snapshots are useful while debugging memory problems. It only shows object on the managed heap. After two or more snapshots, these will be compared with each other. The deltas can be visualized, making it easy to find the offending objects. Cycles in the reference graph is automatically detected. Remember to clear your event handlers. Snapshots can also be taken while the application is running, but the object instances can only be inspected if you’re stopped at a breakpoint.
 Intelligent filtering.
The native debugger can also be enabled, thus showing you native objects in your snapshots.
A garbage collections is simulated before showing the objects in the snapshot.
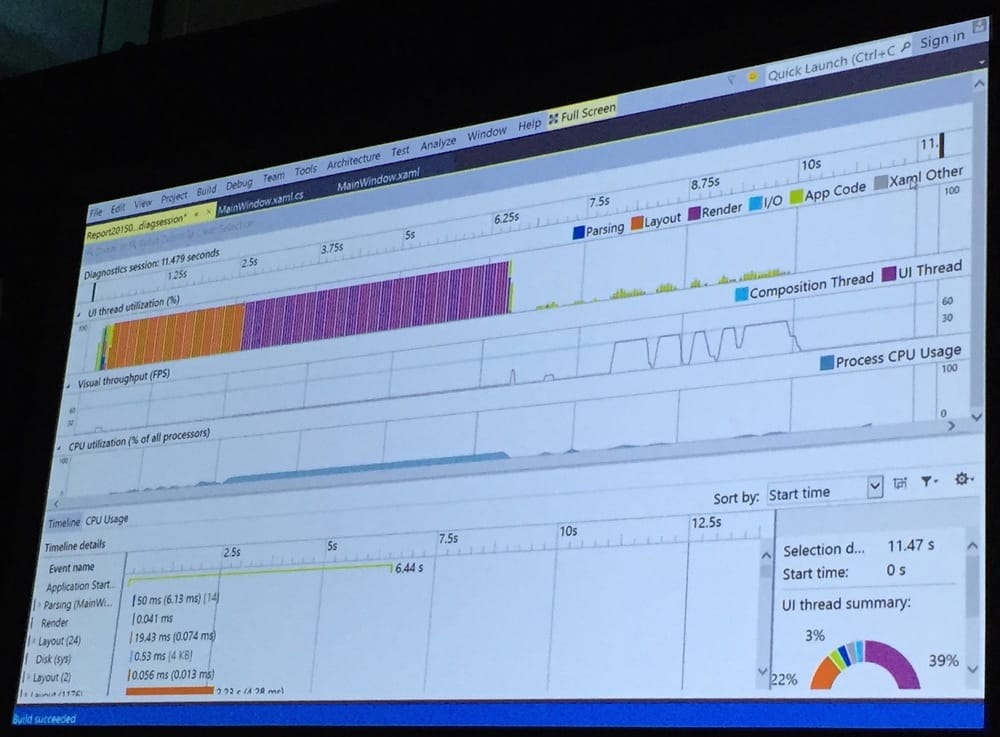
The timeline tool supports both WPF and Universal Applications. A ListView.GroupStyle disables virtualization in WPF.
 The Timeline tool is going to be wicked useful.
Delay loading of images and other large assets during scrolling, load only when scrolling has stopped.
CPU profiling can be xcopied and used in production in Windows 8 and later.
The Performance Wizard contains more specialized profiling tools.